290+ Battery Cells.
Lab-Measured.
Compare in Seconds.
Stop relying on datasheets. Access independently lab-measured performance data for 290+ lithium-ion and sodium-ion cells — for cell selection, technology radar, and benchmarking.
Covering cells from Samsung SDI, LG Energy Solution, CATL, BYD, Panasonic, Molicel, EVE Energy, and more — all measured under identical standardized conditions.
Built for every stage of battery cell evaluation
Find the right cell - fast
Narrow down from 290+ lab-measured cells to your shortlist for EV, energy storage, or power tool applications. Filter by performance criteria, compare candidates side-by-side, and make data-driven cell selection decisions — without reading a single datasheet.
Track what’s new in battery technology
Stay ahead with the technology radar: monitor cathode chemistry evolution, track performance envelope shifts year by year, and benchmark emerging sodium-ion cells against established LFP. Always up to date.
Compare cells and share results
Put cells side-by-side with interactive Ragone plots and radar charts. Export charts for your next team meeting or management report. Why characterize cells in your lab when Batemo has already measured 290+?
Everything you need to evaluate and compare battery cells — in one database
Explore 290+ Cells
Filter by cell format (18650, 21700, 46XXX, 26XXX, pouch, prismatic), cathode and anode chemistry (NMC, NCA, LFP, graphite, silicon), manufacturer, capacity, and energy density. Find the right lithium-ion or sodium-ion cell in seconds.
Try it out! →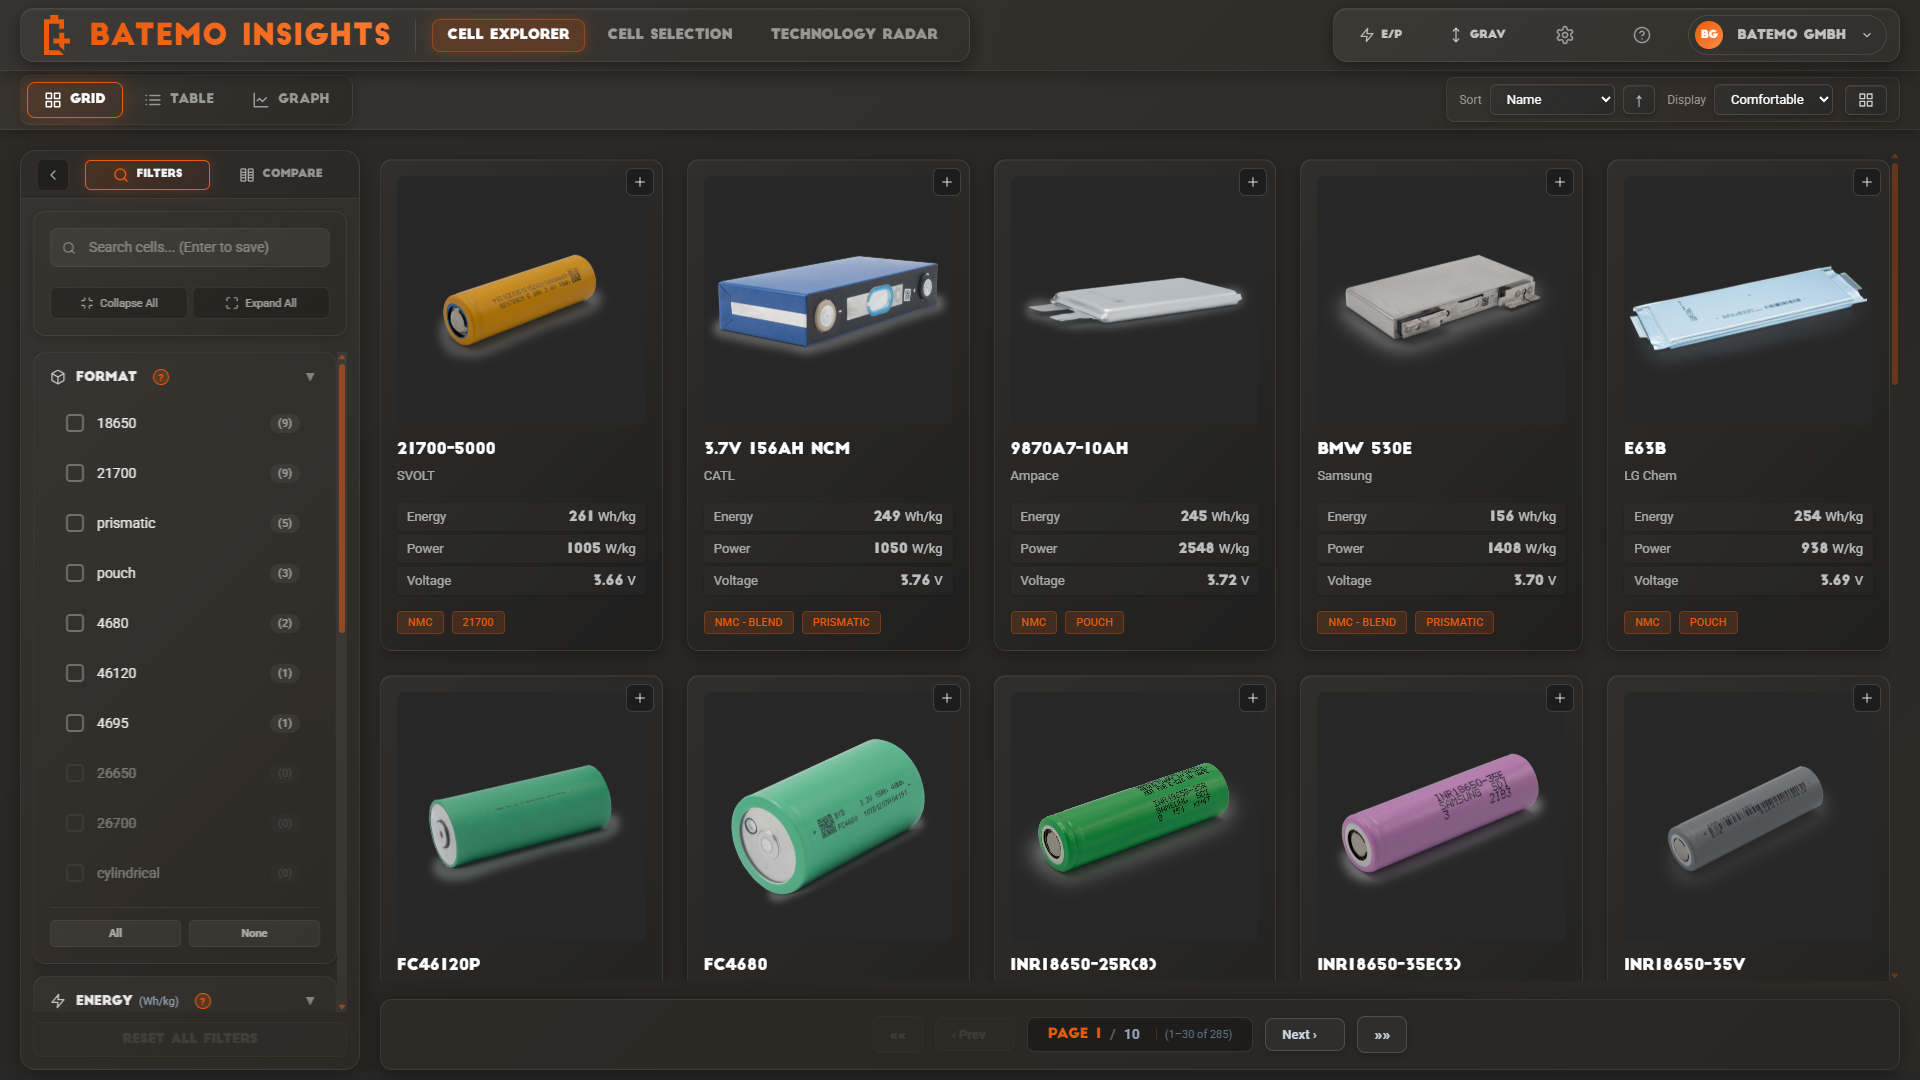
Compare & Benchmark
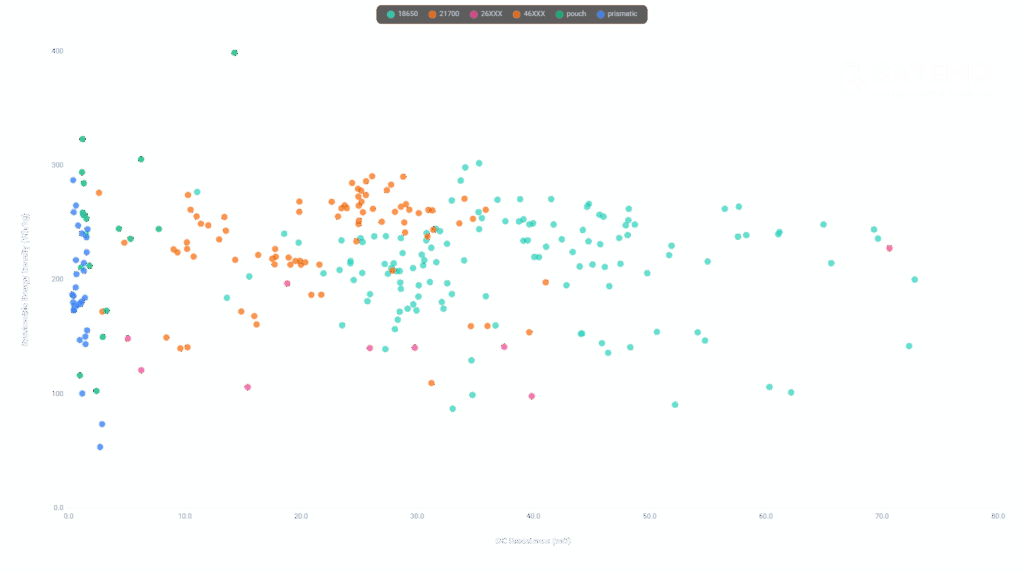
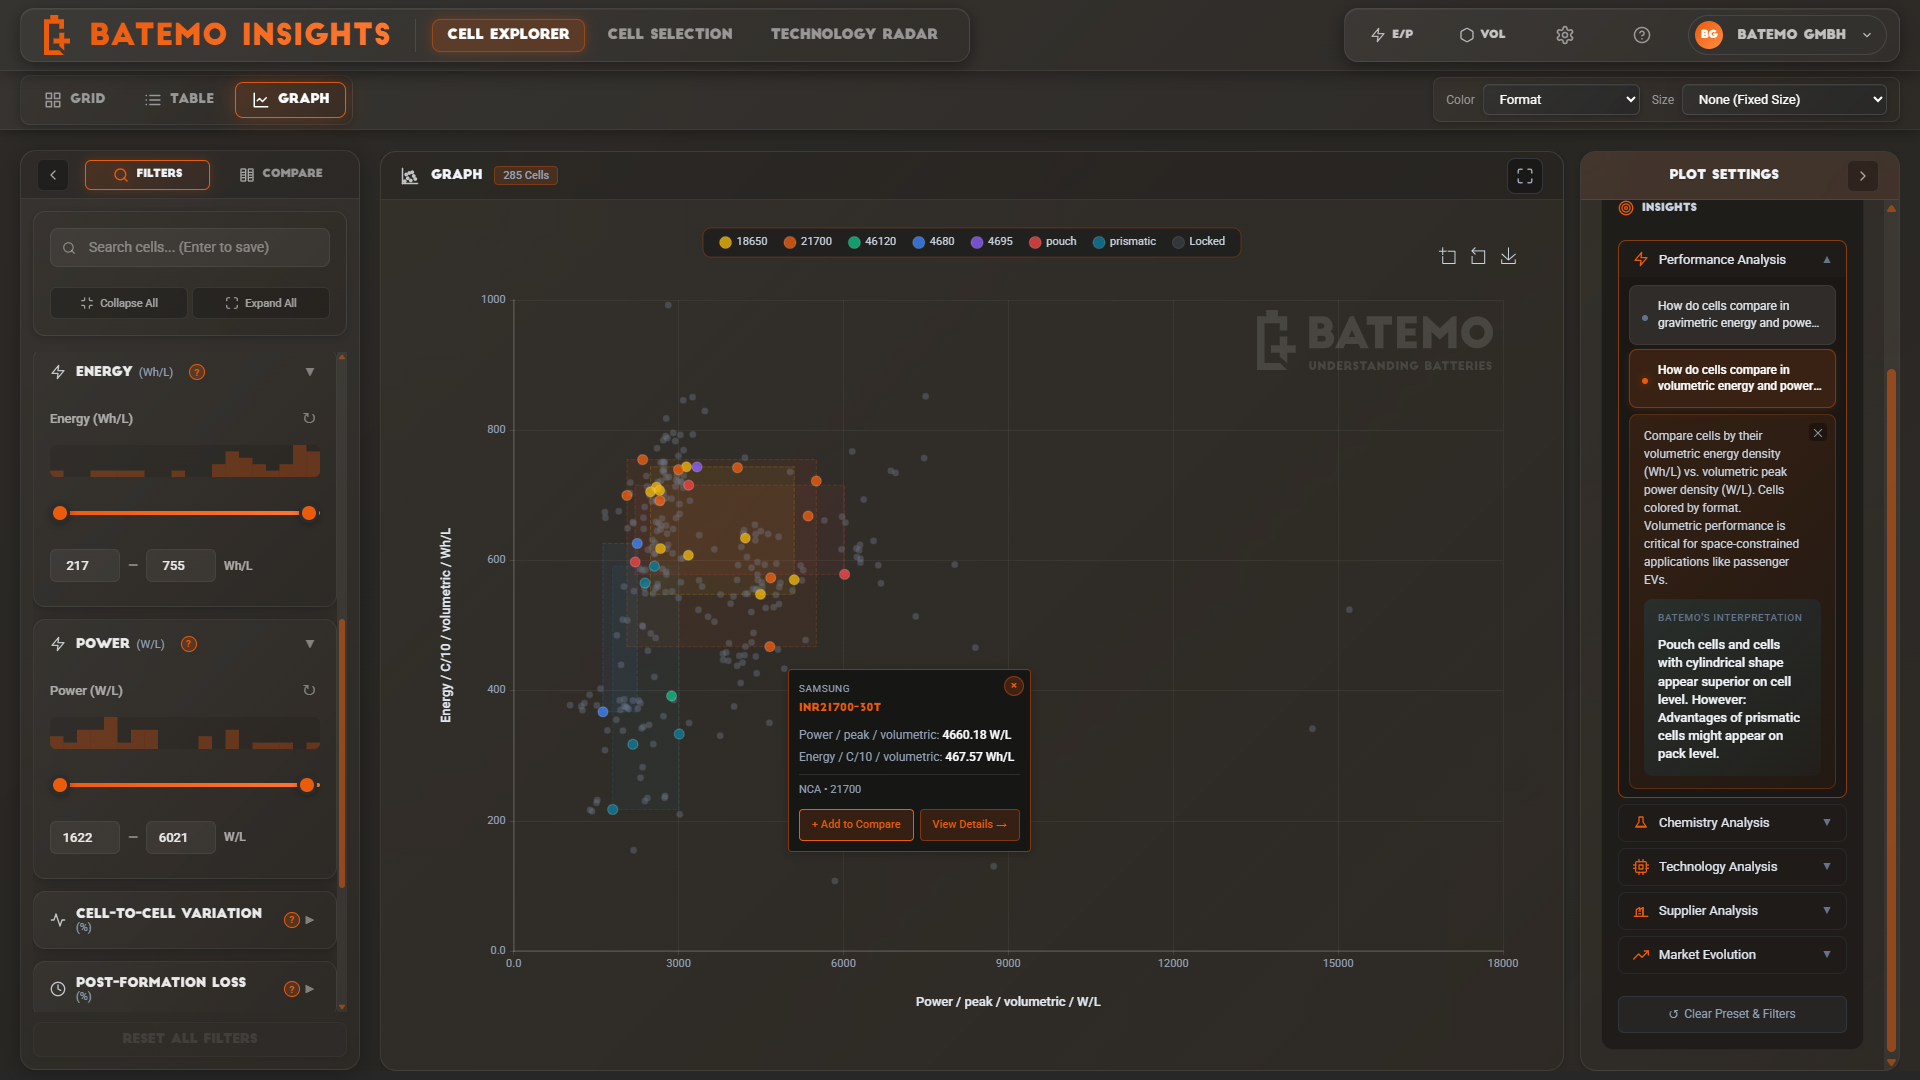
Put cells side-by-side with interactive Ragone plots, radar charts, and direct comparison views. See exactly how cells compare in energy density (Wh/kg), power density (W/kg), and thermal performance.
Try it out! →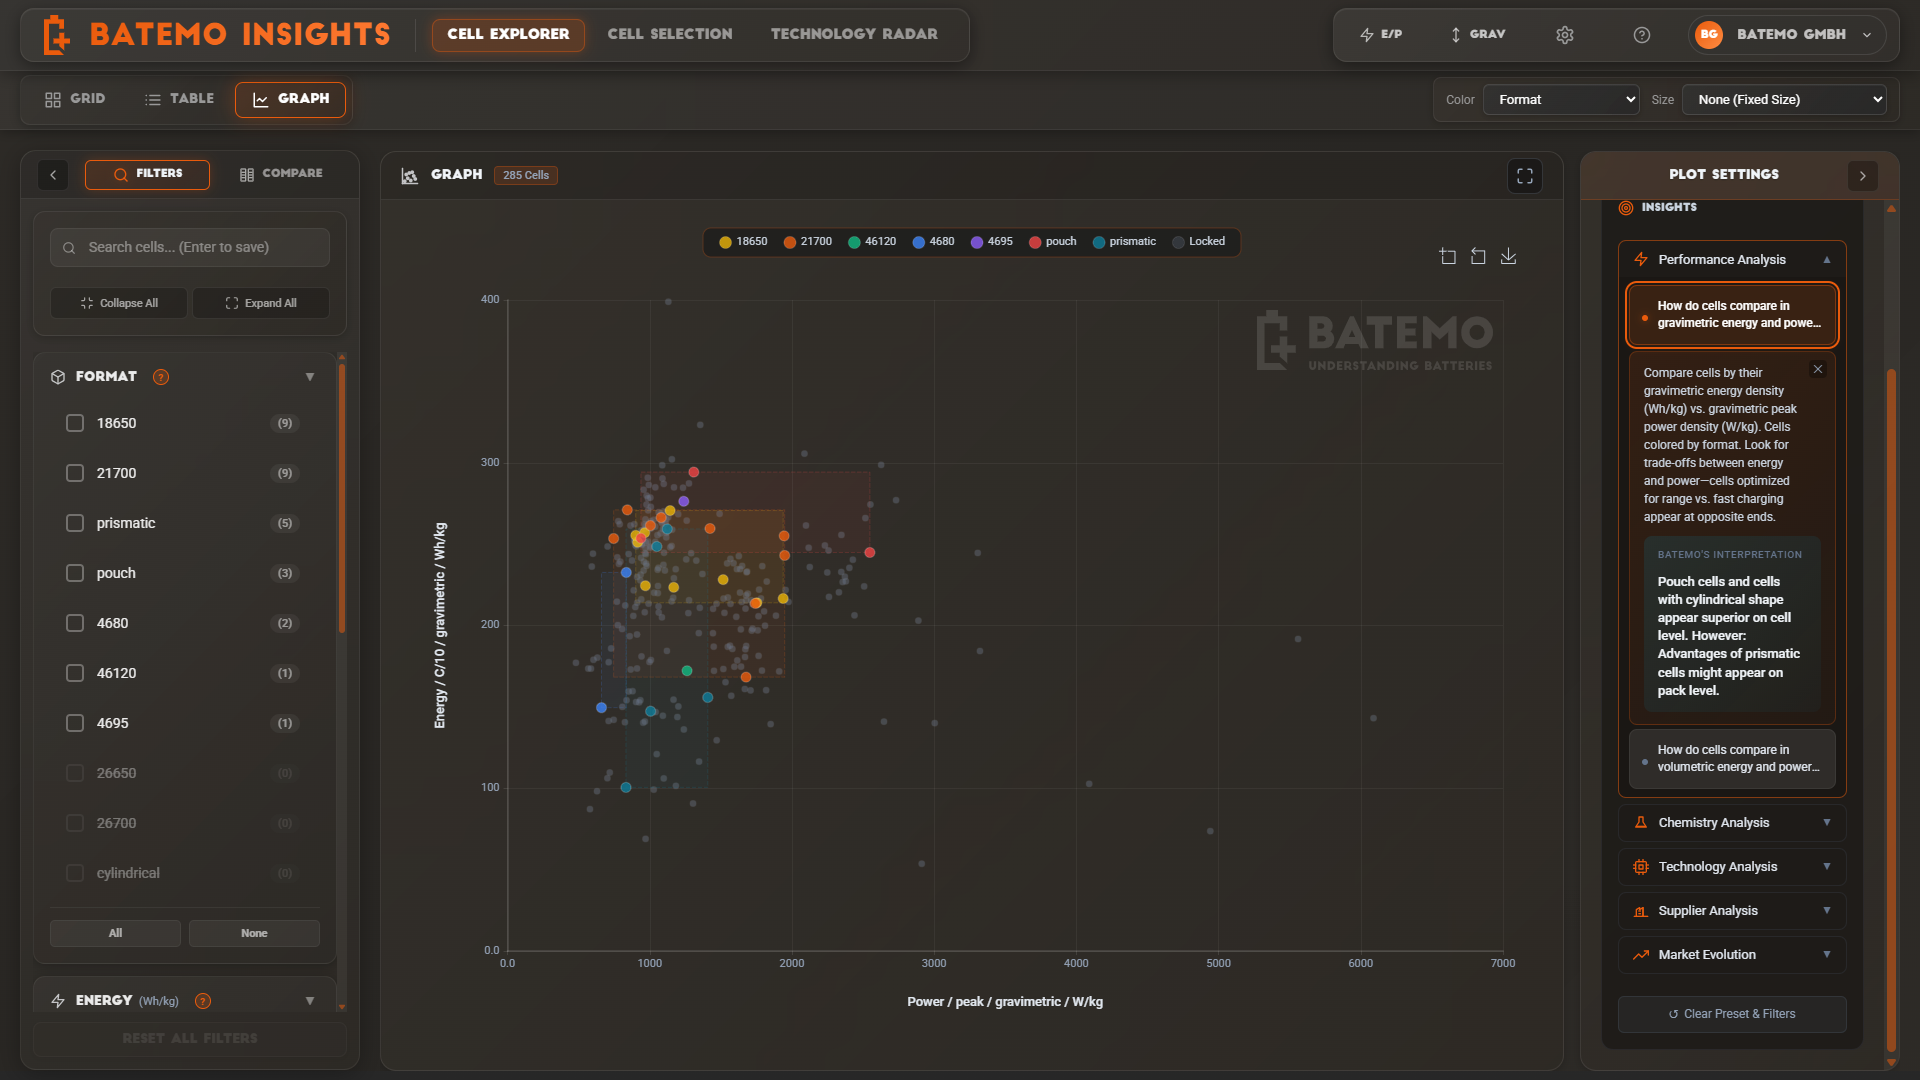
Full Cell Characterization Data
Go beyond datasheets with electrochemical impedance spectroscopy (EIS), heat power and thermal properties, internal resistance, discharge curves at multiple C-rates, usable energy at multiple temperatures, and post-formation capacity loss — all independently measured under standardized conditions.
Try it out! →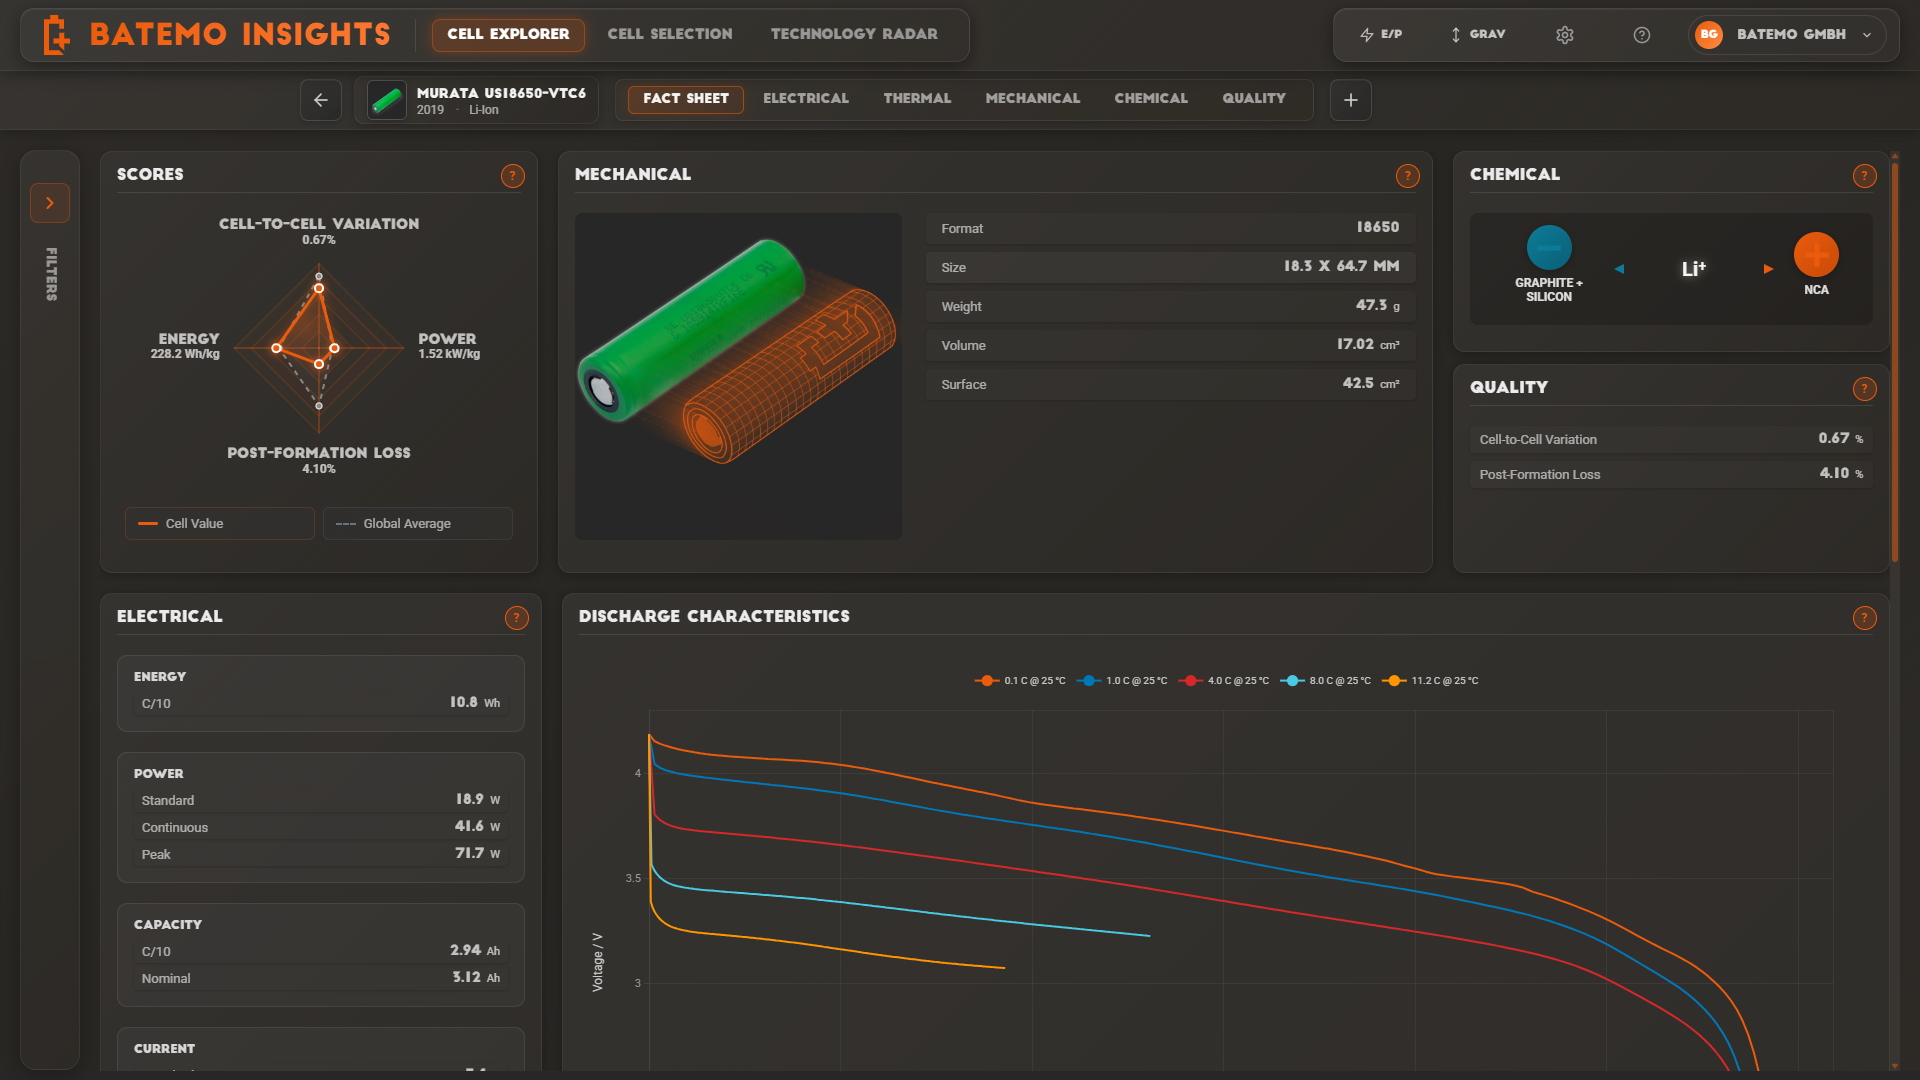
Answer Real Questions — Instantly
Pre-configured analytical questions across cell performance, cathode chemistry, technology evolution, and supplier analysis. Each with expert-level visualization and automatic trend detection.
Try it out! →See where battery technology is heading — backed by lab data
Expert-curated stories with interactive charts. Track cathode chemistry evolution, performance envelope shifts, and emerging technologies like sodium-ion — ready for your next strategy presentation.
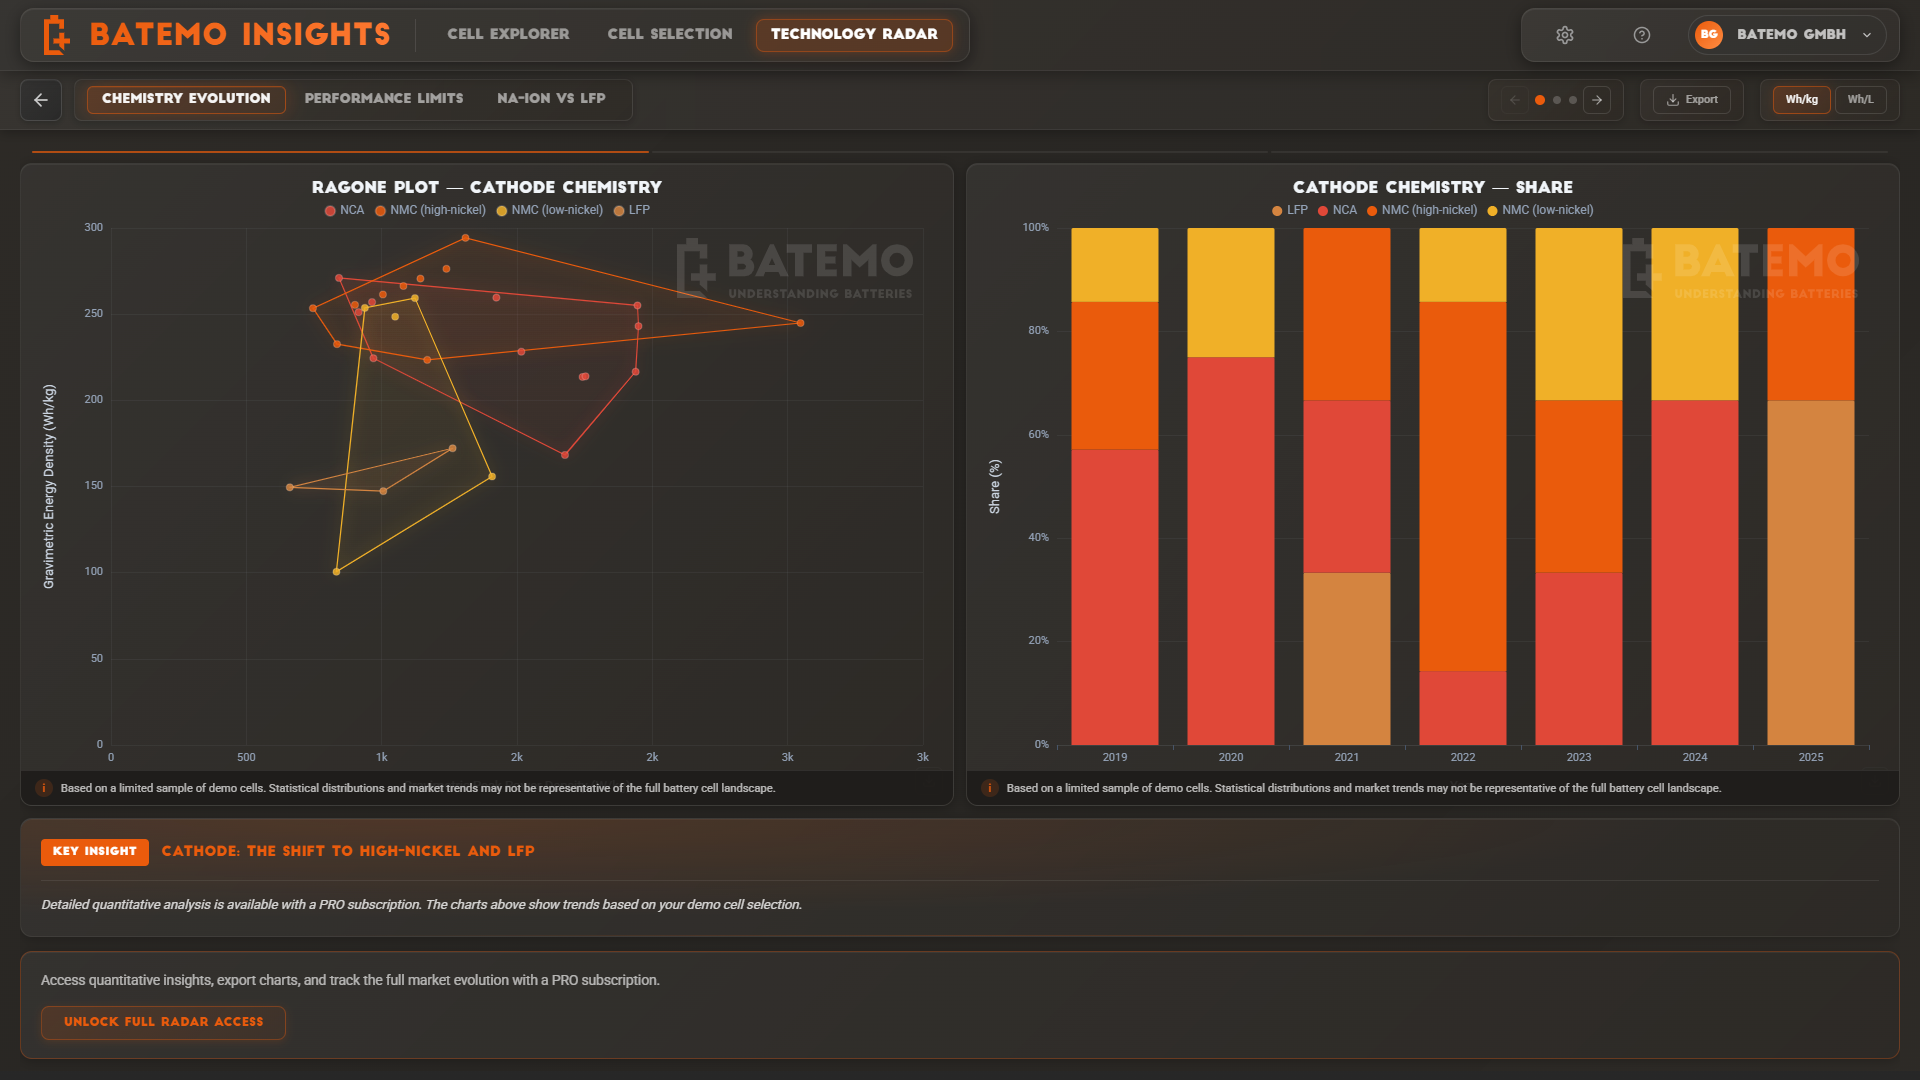
How cathode chemistries are evolving
From NMC dominance to the rise of LFP and silicon anodes — trace the material evolution driving today’s cells. Includes Ragone plot by cathode chemistry and share trends over time.
Explore the full analysis →Are we approaching the ceiling of lithium-ion performance?
Explore the energy-power trade-off boundary across all 290+ measured cells. Track how the performance envelope has expanded year by year.
Explore the full analysis →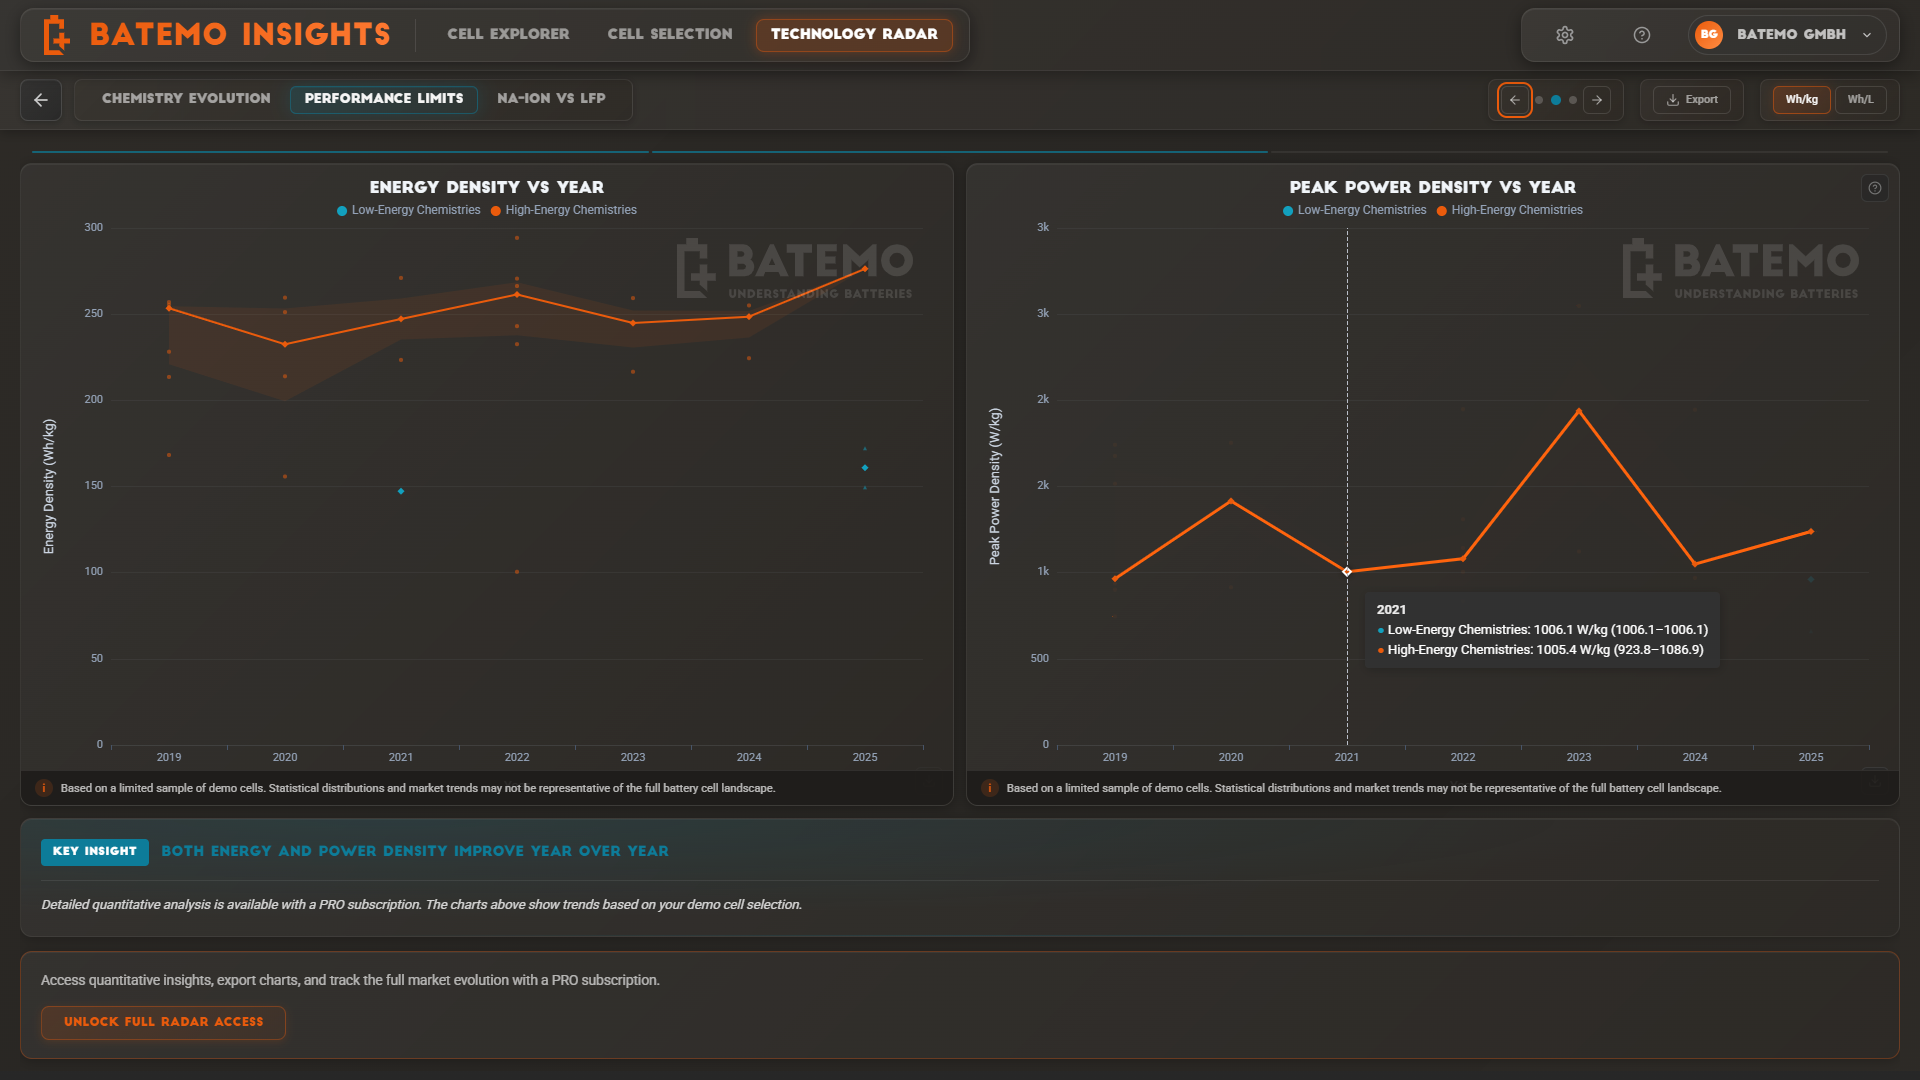
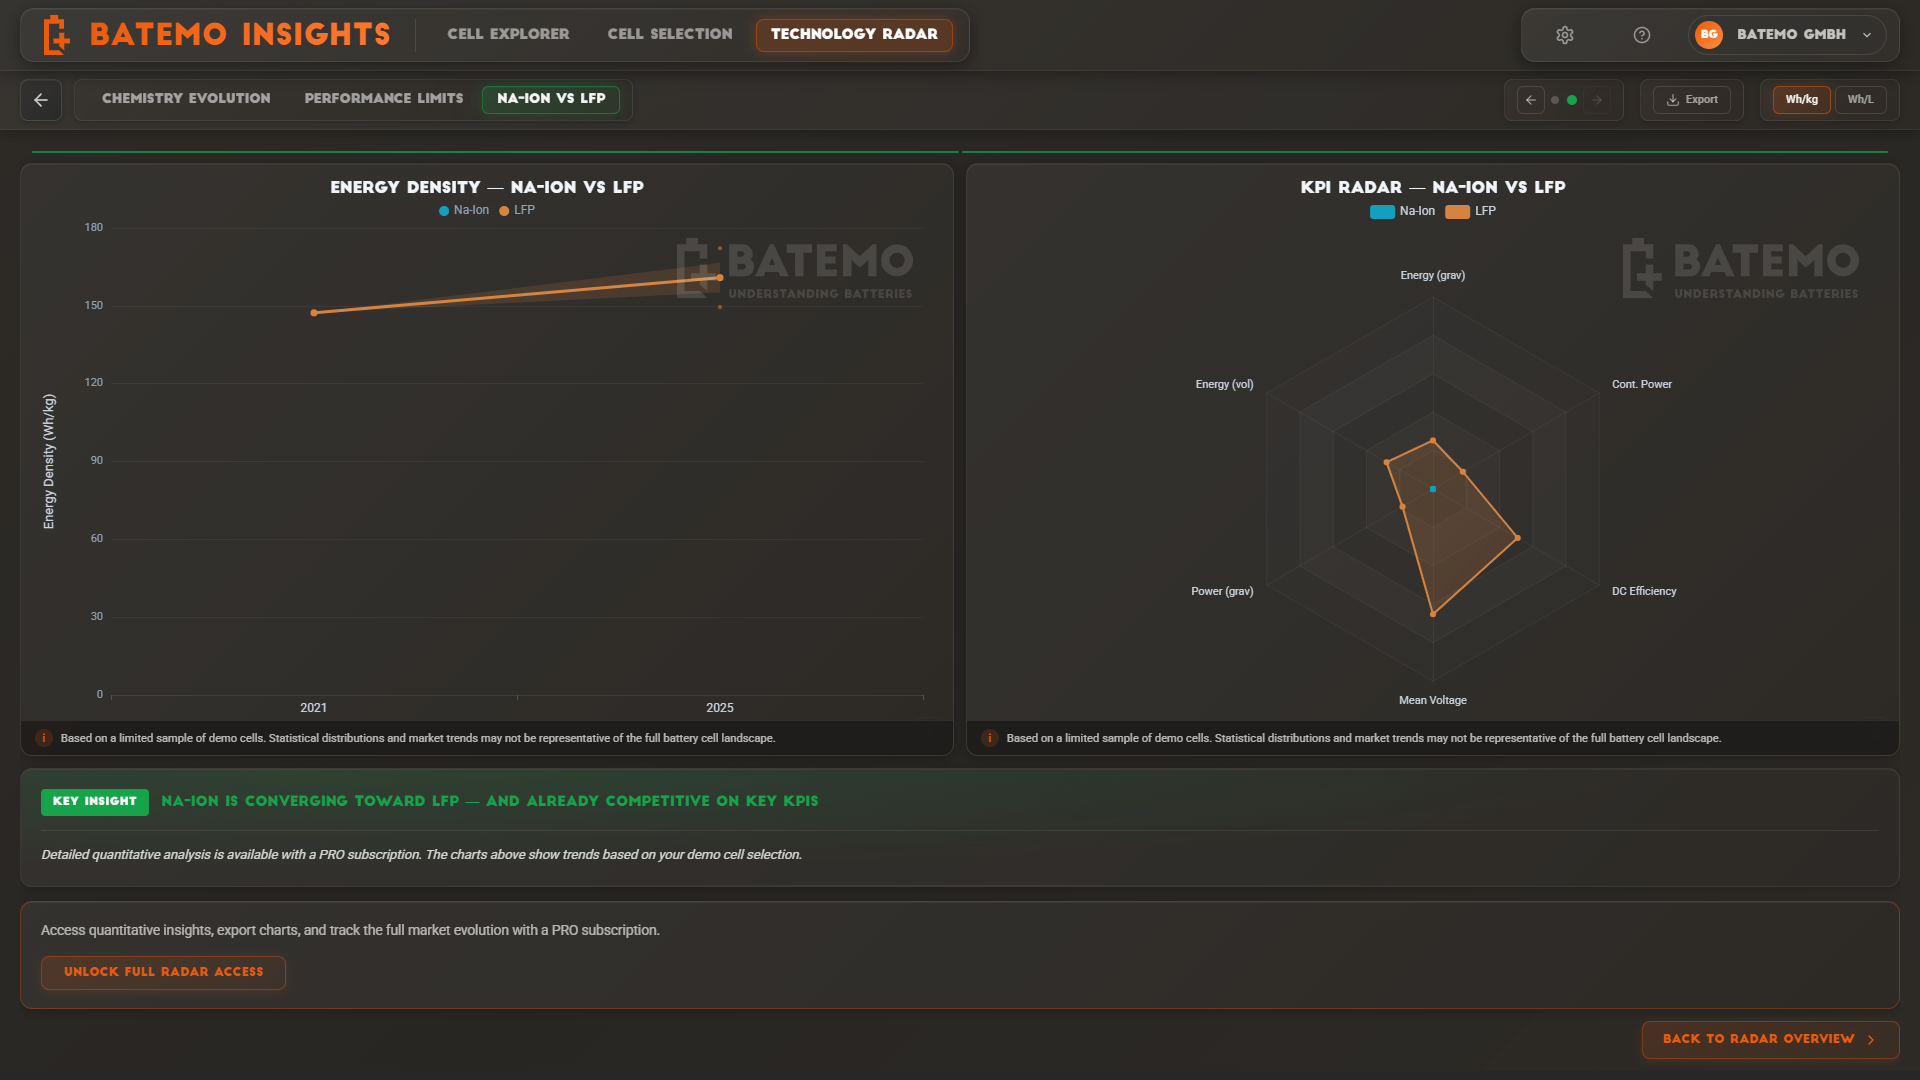
Can sodium-ion cells compete with LFP today?
A head-to-head comparison of sodium-ion and LFP cells across energy density, power density, and key performance indicators — with real lab data, not manufacturer claims.
Explore the full analysis →Export any story for your next team meeting or management report.
Explore the technology radar →Why Engineers Are Moving Beyond Datasheets
Datasheets give you one data point per metric, measured under conditions chosen by the manufacturer. Batemo Insights gives you the full performance map — measured under identical, standardized conditions for true apples-to-apples comparison.
| Feature | Datasheets | Batemo Insights |
|---|---|---|
| Data Source | ✗ Manufacturer claims | ✓ Independent lab measurements |
| Consistency | ✗ Varies by manufacturer | ✓ Standardized across all cells |
| Comparability | ✗ Manual, error-prone | ✓ One-click benchmarking |
| Data Depth | ✗ Basic specs only | ✓ EIS, thermal, post-formation loss, curves |
| Coverage | ✗ One cell per PDF | ✓ 290+ cells in one platform |
The math: full cell characterization vs. Batemo Insights
Browse the cell library
Loading 290+ cells…
| Manufacturer | Cell Name | Format | Chemistry Analysis |
|---|
Start free. Upgrade when you’re ready.
Free Trial
Explore the full platform with 30 sample cells for 7 days. No credit card required.
- 30 cells included
- Full platform access
- All charts & comparisons
- Chart export (PNG)
No credit card required
PRO
Full access to all 290+ cells, always up-to-date data, and chart export.
- All 290+ cells
- All charts, comparisons & exports
- Always up-to-date data
- Chart export
- Priority email support
- technology radar with curated industry analysis
- Full platform access
Pay by credit card or request a quote
Need a team license or custom integration? Contact us
Frequently Asked Questions
Every cell in Batemo Insights is independently measured in our lab. You get discharge curves at multiple C-rates, usable energy at multiple temperatures, EIS data, heat power and thermal properties, post-formation loss behavior, and 150+ performance metrics — all standardized for direct comparison.
Datasheets are marketing documents with manufacturer-optimized numbers measured under favorable conditions. Batemo Insights provides independently measured data under standardized conditions, making cells truly comparable.
Our lab continuously measures the latest cells from all major manufacturers. PRO subscribers get access to new cells as soon as they are published.
After 7 days, your trial access expires and you can no longer view cell data. You can upgrade to PRO at any time to restore full access. No data is lost — your preferences and saved comparisons are preserved.
Yes. For teams of 3+ users, we offer volume pricing. For enterprise needs, please contact us at sales@batemo.de.
Batemo Insights covers all major lithium-ion cathode chemistries including NMC (nickel manganese cobalt), NCA (nickel cobalt aluminum), and LFP (lithium iron phosphate), as well as emerging sodium-ion cells. Anode materials include graphite, silicon-graphite blends, and LTO. Cell formats include cylindrical (18650, 21700, 46XXX, 26XXX), pouch, and prismatic — from leading manufacturers worldwide.
Yes. We strongly focus on continuity across our product world. Batemo Insights provides the measured cell data, and Batemo Cell Models allows full simulation-based battery development. Please contact sales@batemo.de for details on how to combine both products.
The technology radar is a curated analysis feature with interactive stories — for example Chemistry Evolution (how cathode chemistries are shifting), Performance Limits (energy-power envelope trends over time), and Na-Ion vs LFP (a data-backed comparison of emerging sodium-ion vs. established LFP cells). New stories are added over time. Each story includes interactive charts and can be exported for presentations.
Your next cell decision starts here
Free. 7 days. 30 cells. No credit card.
Start Free Trial Now → Or request a guided walkthrough →